

It’s often claimed that good poker strategy involves a mixture of –
- Game theory
- Probability
- Psychology
- Statistics
How exactly, though, do poker make up part of a strong player’s outlook?
Players can use poker stats to adjust their game and improve skill.
In this article you will learn how to understand and use poker statics based on the following topics:
We’ll consider 7 ways in which applied stats can be used in the world of poker.
1. Odds of Hitting a Hand
Poker players make estimates about how often a particular hand is likely to hit, Tis calculation is based on the number of potential “outs” left in the deck.
For example, in Hold’em, a flopped flush draw will hit by the river roughly 36% of the time. Calculating such values on the fly mostly falls within the realm of probability rather than poker statistics.
When players attempt to memorise important values en masse in advance, it now falls within the branch of poker statistics.
Rather than look to calculate values mid-hand, experienced players memorise pre-calculated numbers.
Here is an example of a group of stats a poker player may aim to familiarise themselves with.
The following table shows the chances of hitting hands in Holdem, based on the number of outs and the current street.
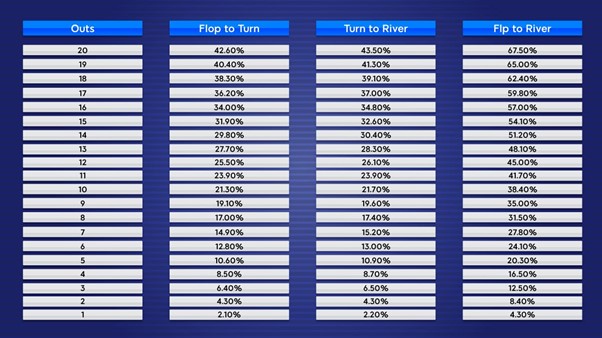 Chances Of Hitting Hands In Hold’em
Of course, all these numbers can be calculated using techniques found in the field of probability.
But calculating values mid hand is a waste of valuable time. many players prefer to “just know” the above essential values.
Odds of Hitting a Hand – Essential Stats
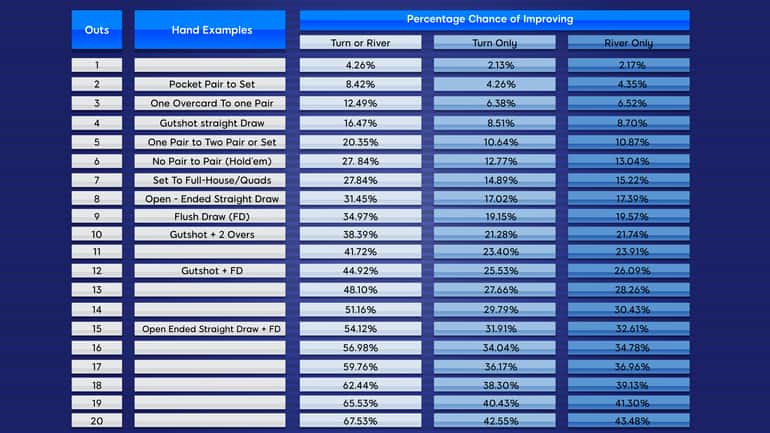 Hitting Specific Draws By The River
- Hitting a flopped flush draw by the river - 35%
A flush draw on the flop hits roughly 35% of the time by the river. Assuming we only see the turn, we’ll hit our flush around half as often.
It’s worth remembering the stats associated with hitting various types of holding. This method works better than attempting to calculate mid-hand.
- Hitting a flopped open ended straight draw by the river - 31.5%
An open-ended-straight-draw(oesd)on the flop hits roughly 31.5% of the time by the river. Similar to above, this assumes that we’ll see both the turn and river.
- Hitting a flopped gutshot by the river - 16.5%
A gutshot straight draw on the flop hits roughly 16.5% of the time by the river.
- Flopping a set after playing a pocket pair preflop - 11.8%
When playing pocket pairs preflop we’ll flop a set around 11.8% of the time. This statistic can help us decide whether set-mining is profitable.
2. Pot Odds and Break-Even Points
Both “pot odds” and “break-even points” can also be calculated on the fly using probability. Once again, many players choose to memorise the following vital values.
The above table might prove confusing to those without a background in poker theory.
Here is a quick explanation -
- Equity Required to Call – Otherwise known as “Pot odds”. Pot odds are different from the “odds of hitting” outlined in the first application of poker statistics. “Pot odds”, when expressed as a percentage, indicate the percentage of the total pot we would be investing on a call.
This number is identical to the amount of pot-equity required to break even on a call when closing the action.
For example, according to the above chart, if our opponent makes a 50% pot-sized bet, we’d be investing 25% of the total pot if we made a call.
Assuming we are closing the action, we’d need at least 25% pot equity to break even.
- Break-Even Point of Bluff – This value shows us the bluff frequency (of a specific size) needed to take down the pot to be directly profitable (ignoring any pot equity).
For example, a 50% pot-sized bet would need to take the pot down 33.33% of the time to be directly profitable.
All these values can be calculated directly on the fly using probability. But most serious poker players prefer the statistics-based approach of simply memorising all fundamental values.
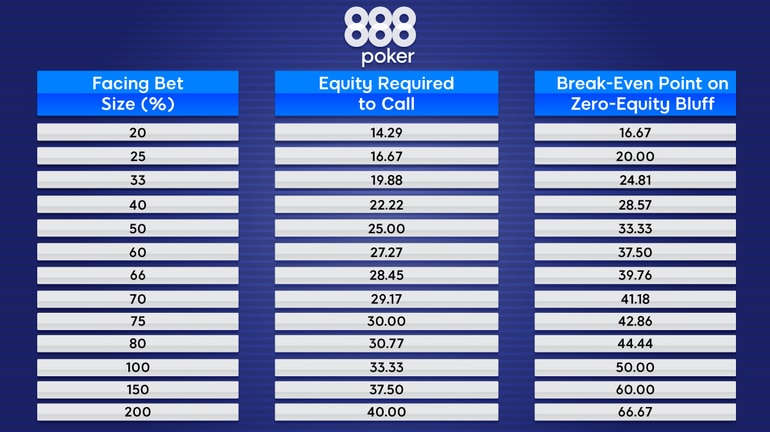
Pot Odds and Break-Even Points - Essential Stats
The following table shows us our pot odds (as a percentage) when facing standard bet sizings:
| Facing Bet Size (%) | Pot Odds (%) |
|---|---|
| 20 | 14.29 |
| 25 | 16.67 |
| 33 | 19.88 |
| 40 | 22.22 |
| 50 | 25.00 |
| 60 | 27.27 |
| 66 | 28.45 |
| 70 | 29.17 |
| 75 | 30.00 |
| 80 | 30.77 |
| 100 | 33.33 |
| 150 | 37.50 |
| 200 | 40.00 |
- Required equity to call facing a half pot bet on the river - 25%
When we face a half-pot bet, we need to be good more than 25% of the time to call profitably. It’s good to remember these basic stats rather than attempt to calculate them on the fly. - Required equity to call facing a pot sized bet on the river - 33%
We need to be good more than 33% of the time when facing a pot-sized bet. we don’t need to be a favourite to call since there are already chips in the middle. - Break-even point on a half pot river bluff - 33%
When we make a half pot bluff it’s directly profitable if our opponent folds more than 33% of the time. It may be worth betting any 2 cards if we believe our opponent is folding significantly more often. - Break-even point on a pot sized river bluff - 50%
A pot sized bluff needs to work over 50% of the time to be profitable.
3. Using Poker Statistics for DB Analysis
Online poker players typically track their played hands using poker tracking software. Said software stores every hand played. It compiles the data to display essential poker stats, such as “number of hands played” and “total winrate”.
Here’s a formula for calculating your tournament ROI:
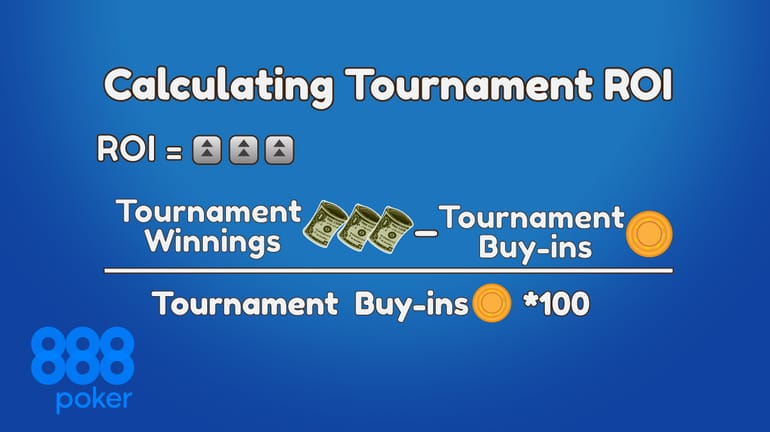 Calculating Tournament Winrate
Tracking software offers hundreds of stats, These also display information on specific aspects of a player’s game, for example -
- How often a player fires a continuation bet on each street.
- How often a player folds to a continuation bet on each street.
- How often a player 3bets preflop.
- How often a player folds to a preflop 3bet
- How often a player raises the flop
In fact, pretty much any conceivable scenario can be tracked. Many poker trackers offer the ability to create custom statistics.
Serious players dedicate significant time to trawling through their various poker statistics. They compare their results to the stats of strong winning players. This is a great way to spot leaks. It allows us to analyse an extensive sample of hands quickly.
Many poker players have direct experience working with a database of statistics. They use them to probe for weaknesses by applying a range of filters.
Using Poker Statistics for DB Analysis - Essential Stats
- VPIP
VPIP stands for ‘voluntarily put in pot’ and describes the percentage of starting hands that we play. We would typically expect our VPIP to be somewhere between 20 and 28% in 6-max No-Limit Hold’em.
- PFR
PFR stands for ‘preflop raiser’/ It describes the percentage of starting hands that we raise preflop. We would typically expect our PFR to be somewhere between 16 and 23% in 6-max No-Limit Hold’em.
- Preflop 3bet
A preflop 3bet is a re-raise on the preflop betting round when facing an open-raise. In many situations 3betting against an open-raise may be more profitable than cold calling. Winning 6max regulars typically have a 3bet stat somewhere between 7-9%.
- Cold-call
A preflop cold-call is where we just call when facing a preflop open-raise. Even though we have the opportunity to 3bet, cold-calling is still an integral part of good strategy. Winning 6 max regulars typically have a cold-call stat of around 12%.
4. Using Poker Stats for Villain Analysis
If we can analyse our own data, we can absolutely analyse our opponent’s data.
We can probe his statistics in much the same way that we do our own. This time we have a different goal in mind.
We are looking for weaknesses in our opponent’s game, which we can exploit.
Here’s a chart of some of the characteristics of opponents we might face:
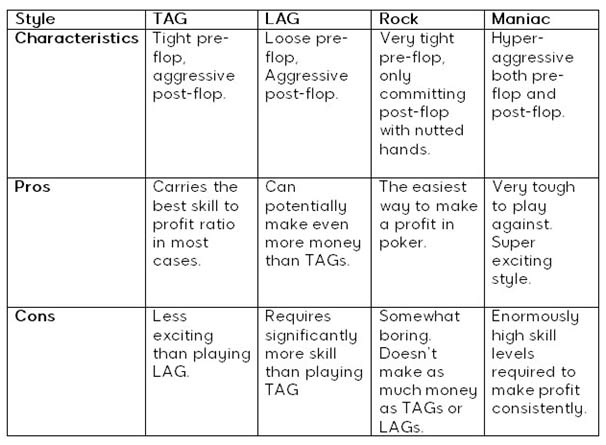
Using Poker Villain Types as Statistics
For online players, it’s commonplace to display poker statistics on opponents in real time. Use a table Overlay known as a HUD (heads up display). Accurate poker stats usage is a crucial factor in maintaining the highest possible winrate.
There are generally differing opinions on the ethics of HUD usage. Some players will be running a HUD, while others won’t. Naturally, this gives players with a HUD a potential advantage over players that don’t.
This is a concern with some poker rooms. Strong players destroying the weak players too quickly can cause a weak or non-sustainable poker ecology. Some rooms look to limit HUD usage for specific formats or even ban them entirely.
Other rooms consider HUDs fair game since all players have the ability to load a HUD. It’s no secretthat poker rooms which allow HUDs are typically tougher than those that don’t.
Using Poker Statistics for Villain Analysis - Essential Stats
- Fold to Cbet
Fold when facing a continuation bet. This would typically be around 40%. If significantly higher we can begin to cbet hyper aggressively.
- Fold to 3bet
Fold when facing a preflop 3bet. This would typically be around 50-60%. If significantly higher we can begin to 3bet bluff a lot preflop.
- Fold to Steal
Fold when facing an open-raise from button, cutoff or small-blind. This will typically be between 60-70%. If our opponent is folding more, we should look to open-raise more aggressively when they are behind us.
- Raise vs Flop Cbet
Raise facing a cbet on the flop. This is usually between 8 and 12%. If our opponent raises less than this, we can start to make big laydowns when facing flop raises.
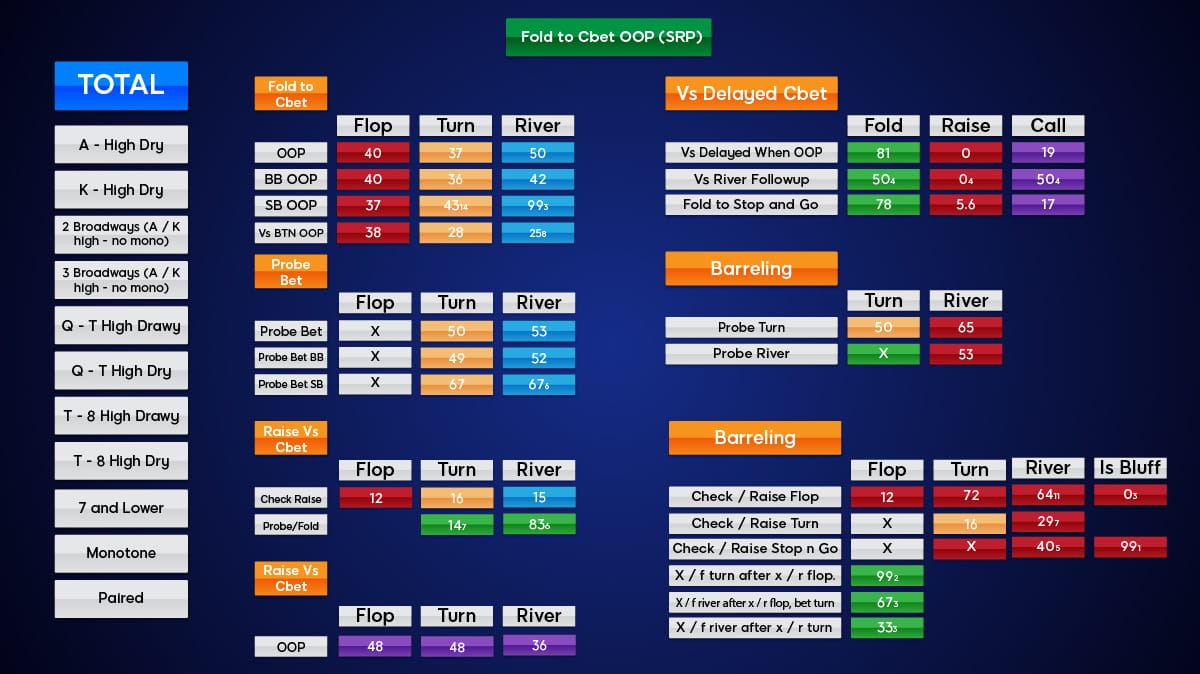
5. Using Poker Statistics for Population Analysis
The term “population analysis” describes the technique of analysing average statistics for the entire population of a certain poker-room, limit, or network.
This topic is similar to “villain analysis” with the key difference.
It does not look to target individual opponents.
Instead, it seeks to capitalise on the mistakes that an average player makes. This data is useful for playing against unknown opponents. We can assume that an unknown opponent’s strategy will typically mirror the common mistakes of the population (on average).
Population analysis techniques are especially useful in anonymous poker environments (where the screen names of all players are concealed).
It was previously believed (although, it seems somewhat naïve looking back) that exploitative poker was not possible in such environments. The only approach was to try and employ some approximation of game theory correct poker.
Using population analysis techniques, it is possible to play exploitative poker in anonymous environments by examining the overall trends of the entire population.
Using Poker Statistics for Population Analysis - Essential Stats
- Fold to flop float bet.
A float bet is a bet vs missed cbet while IP. Many player pools fold too often after open-raising OOP and then checking the flop.
- Fold to delayed cbet.
A delayed cbet occurs when a player skips a flop continuation bet but then fires the turn instead. Many player pools fold far too often when facing delayed cbets.
- Fold to turn probe bet.
A probe bet is a bet vs missed cbet while OOP. Many players fold too often to a turn lead after open-raising IP and then checking back the flop.
- Fold to stop and go.
The term ‘stop and go’ describes a bet-check-bet line (i.e., bet flop, check turn, then bet river). Many players fold too often when facing a stop and go line.
6. Poker Statistics in GTO Play
GTO stands for “game theory optimal”, and it’s the term used to describe a perfect, theoretically correct, game of poker.
Unfortunately, GTO poker is exceptionally complex. It’s often believed that even if we knew what a GTO poker strategy looked like (which we don’t, not entirely), it would be so complicated that only a machine could follow the strategy anyway.
Naturally, there is a lot of data that needs to be considered. This is where statistics come in handy. Game theory solver are tools which make approximations regarding GTO strategy. Generally. they allow us to output results into a database format (such as an excel document).
This chart shows a Beginner GTO Pre-Flop Playable Hands:
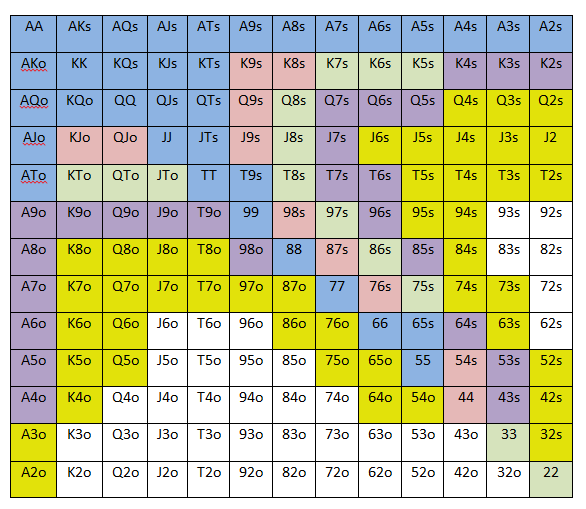
Beginner GTO Pre-Flop Starting Hands
Players who are actively working on developing game theory optimal strategies often have large amounts of information stored in such formats.
They will peruse this information periodically to recap on the various frequencies and strategies advised by their GTO solver.
Poker stats in GTO Play - Essential Concepts
- Game Tree
A game tree is a map of all the possible actions that might happen during a hand of poker. It’s used to calculate game theory strategies. Due to the complex nature of poker, game trees are heavily simplified relative to the actual poker.
- Mix Strategy
Game theory solutions to poker often involve taking more than one action with the same hand. For example, pairs on the flop should often call with some frequency but also raise. The concept of taking more than one action with the same hand is referred to as a ‘mix strategy’.
- Range Advantage
When one player's range of hands outperforms a second player's range of hands, he is said to have a ‘range advantage’.
- Preflop Solve
Many game theory solvers ignore preflop scenarios to prevent the game tree from becoming too large. Running a solve that includes the preflop betting rounds involves a large amount of system resources (especially RAM). This process is referred to as a ‘preflop solve’. Preflop solves are often run using cloud computers rather than local systems.
7. General Poker Stats
General statistics on poker demographics, as a whole, help us to generate realistic expectations playing online poker.
For example, the following (potentially unverified) statistic is often cited –
- 5% of poker players are winning players.
- Less than 1% go on to make big money.
More specific values could be obtained by reviewing the data from particular networks. Having said that, the fact remains that the majority of poker players end up losing money.
This doesn’t mean that poker is not entirely beatable. But it underscores the idea that some measure of hard work will be necessary before we can expect to profit consistently.
General Poker Statistics - Essential Concepts
Basic Maths
To fully unleash the power of statistics on our poker game, it helps to know some basic maths concepts. We should especially be able to fluently switch between fractions, percentages, decimals, and ratios.
Basic Probabilities
Basic probability theory includes understanding how to calculate the probability of two consecutive events. (For example, how often will both blinds fold if we open-raise the button). There are many tutorials online that teach basic probability.
Permutations and Combinations
Permutations and combinations are a branch of probability that help us to answer slightly more complex poker questions involving statistics. For example, combinations can be used to tell us that there are 22,100 different flops in No Limit Hold’em. There are many online tutorials on the topic.
Here are some basic flop to turn to river odds/percentages for hands with up to 13 outs:
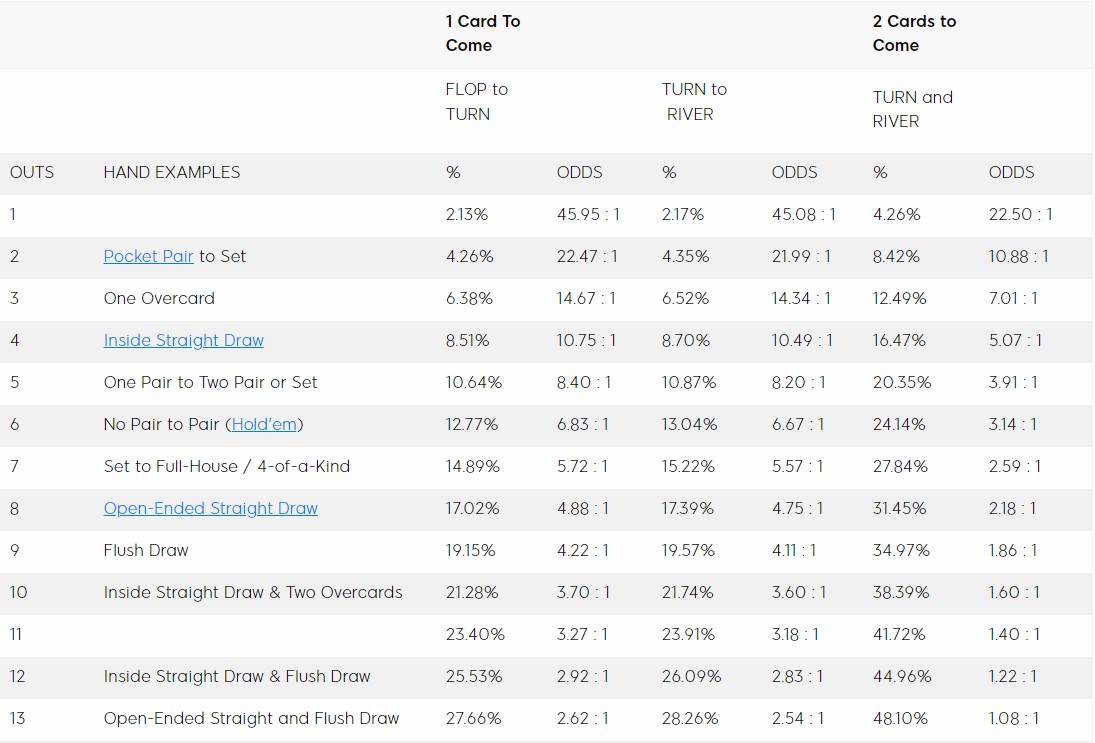 Basic Flop To Turn To River Odds/Percentages For Hands
Poker Statistics and You
The above list is not exhaustive. There are plenty of other ways that the mathematical branch of statistics can be directly applied to the world of poker.
While it’s not entirely a prerequisite, many successful poker players have an interest in statistics. They understand the critical role it plays in generating sound strategies.
First Published on July 28, 2019.
